How Much Do Daily Activities and Diet affect Teen Health?
By Tahj, Brad, Taji, Jake, and Alex
Overview
We orchestrated a survey asking students at AAE about their habits. More specifically, we asked for the student's: age, gender, grade and weight. We decided a good measure for their activity was to inquire about the teen's activity participating in sports and physical activities. After doing some research, we figured extraneous factors such as hours of sleep per night, and diet would also have a large effect on health. This lead us to asking about servings of fruit consumed per day, as well as vegetables.


Data
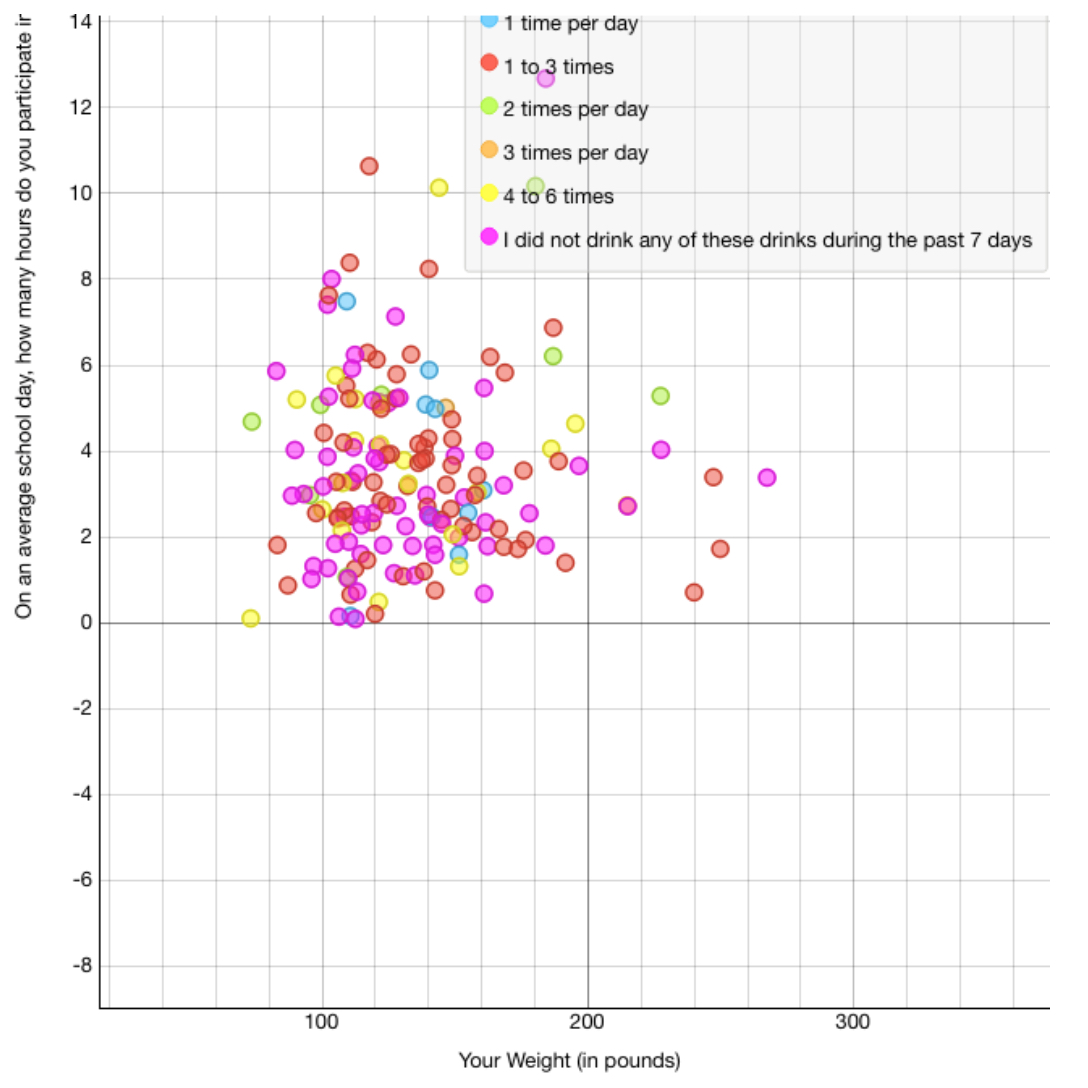
We began by making a scatterplot comparing the relationship of student's weight to their hours of activity daily (far left plot). We thought it'd be smart to include a plot of what student's were drinking that day. The color of each plot point on the scatterplot is a measure of how many times student's drank any: energy drinks, soda, juice, or milk in the past week. From the data that we collected, we could see that majority of students did not partake in the consumption of any of these drinks. Also, we can see that student's weight is widely spread as well as activities, but for the most part, those who are in the correct weight group are active for at least an hour a day.
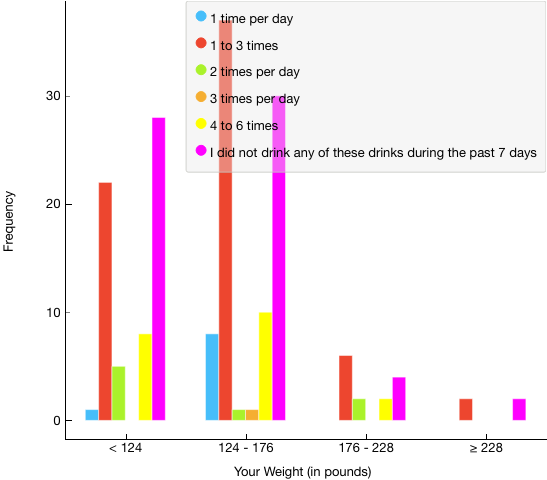
Next, we created a multi-bar graph that mapped a correlation between student's weight and their frquency of consuming these drinks. We used this data analysis method to give a simple visual display of the data we collected. The graph divides the student's into weight classes (i.e. 176-228 lbs.), and the frequency measures the number of students responding to consuming this group of drinks "x amount" of times in the past week. Our data showed that students consuming sugary drinks and milk tend to fall in the 124-176 pound group. However, we do realize that our data can be skewed by the overwhelming majority of students falling into this weight group.
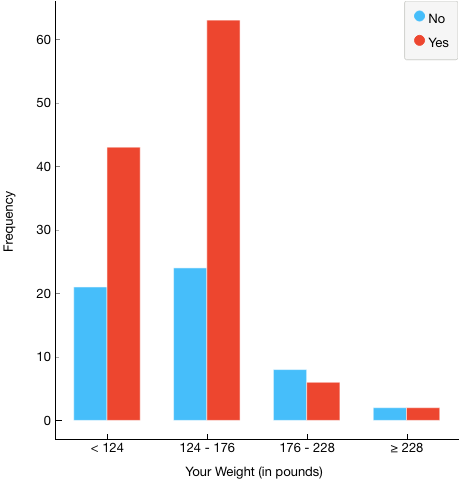
Lastly, we created a bar graph in an attempt to correlate student's weight to whether or not they played sports. We figured this would be important, because participating in sports is a form of guaranteed physical activity, which makes a large contribution towards one's health. The information we received was rather intriguing. We learned that those who do participate in sports usually fall into the 124-176 lb weight group. Few students over the weight of 176 lbs. participated in sports regularly. This lead us to believe that participating in a sport can keep a student's weight low, or possible even help lower weight for students.
Analysis
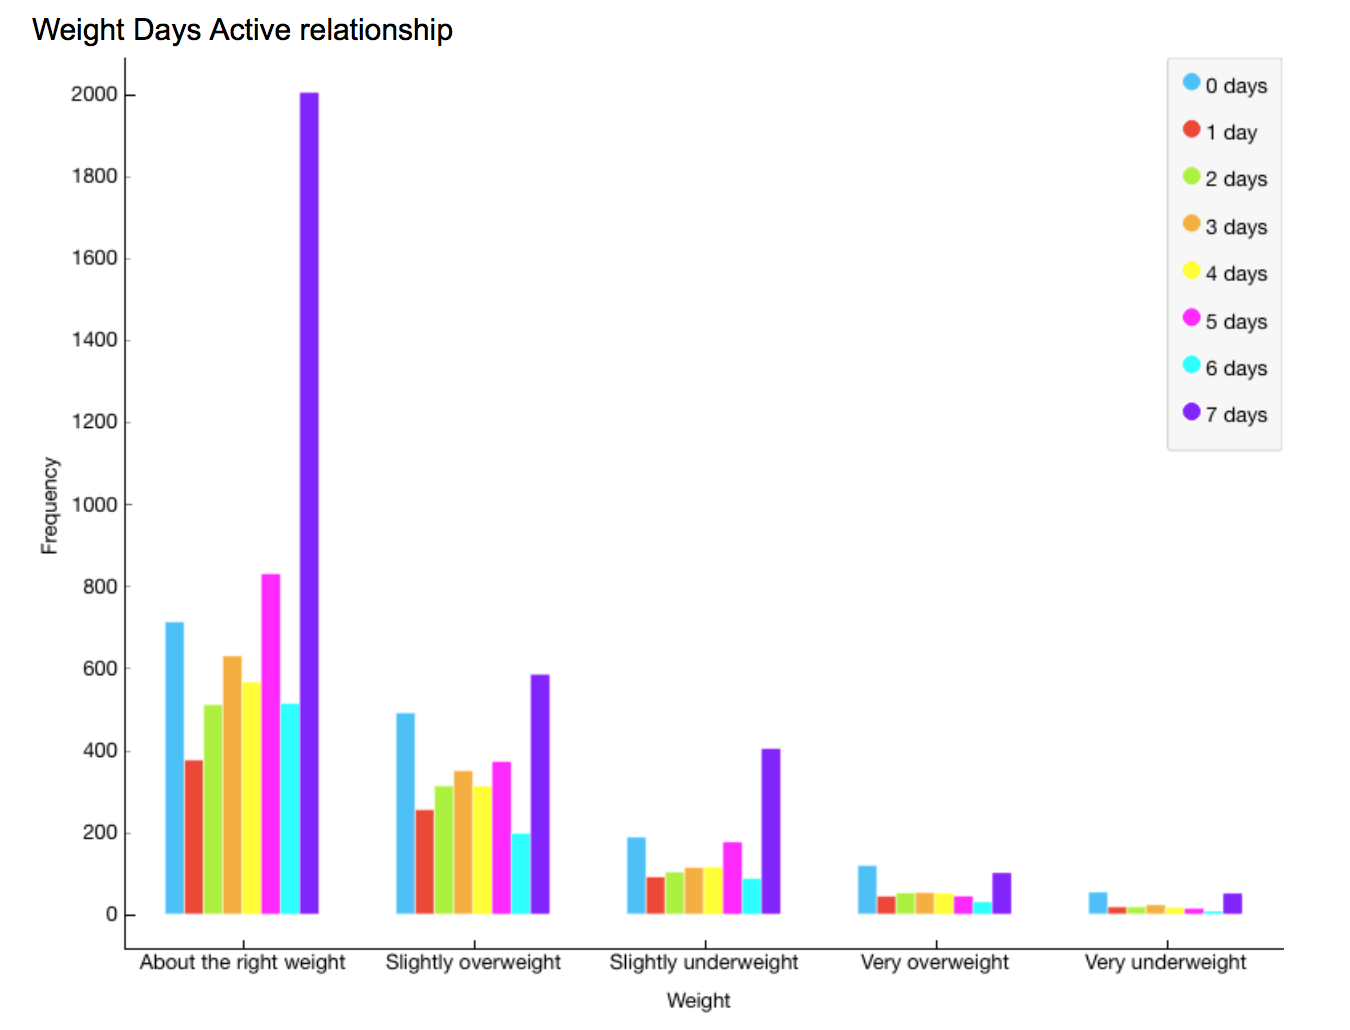
In the parent data, those who reported that they were the right weight, recorded that they exercised 7 days a week. As the value of health decreased, the hours that people had activities went also decreased. Those who were slightly overweight still exercised more than those who were slightly underweight, very overweight, or very underweight. This is most likely because people were reported that they were slightly overweight had an incentive to lose weight and achieve a body image they desired and become about the right weight.
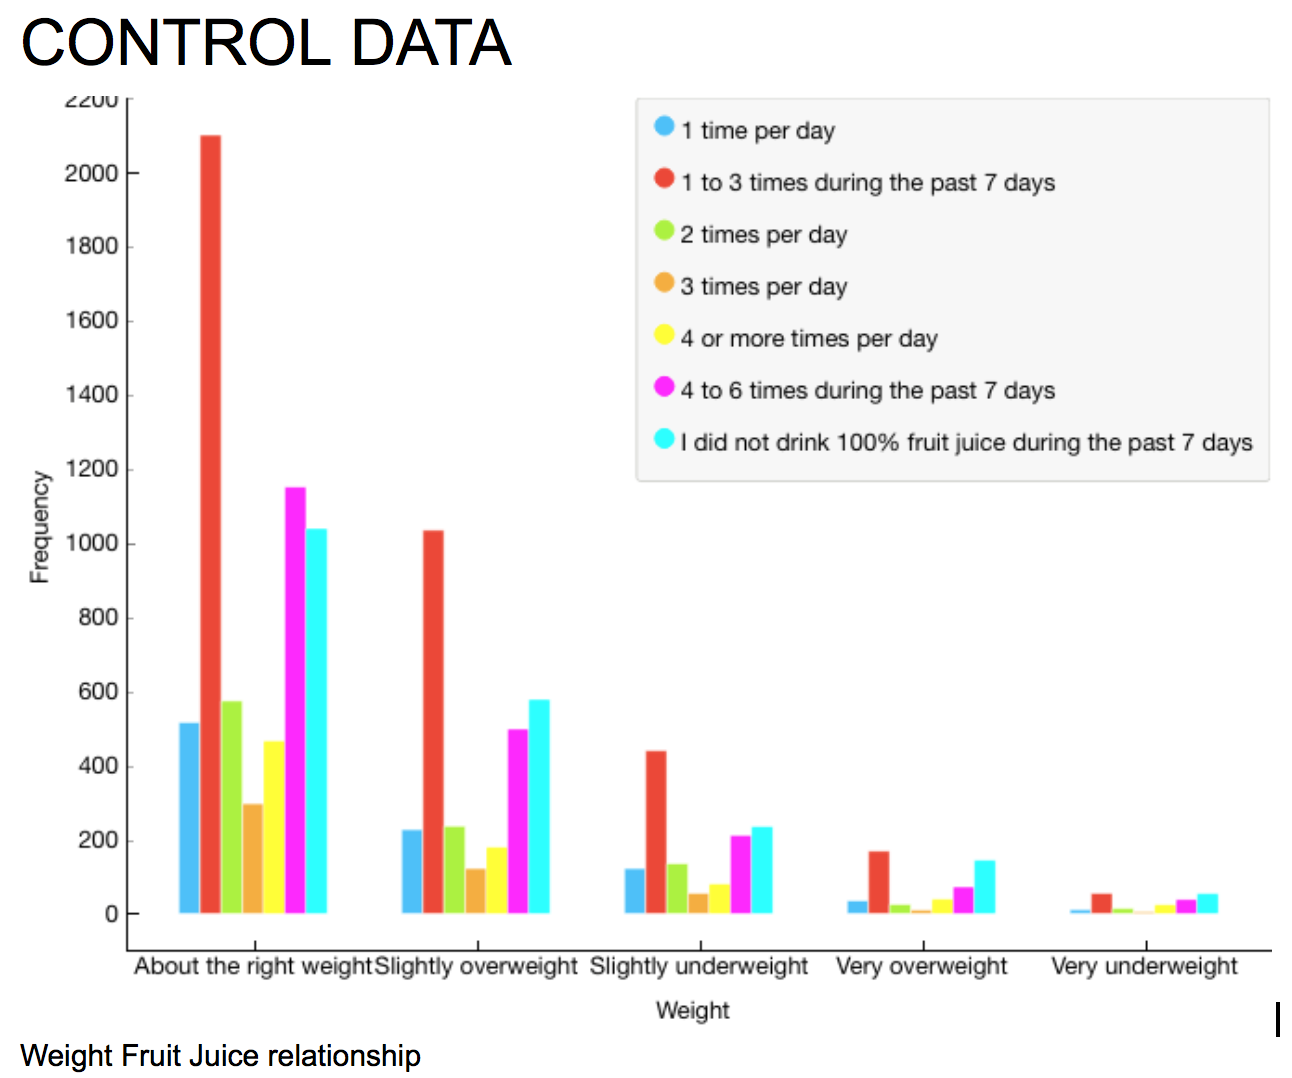
People in the parent data who said they drank fruit juice daily, drank it 1 or 1-3 times a day during a week reported they were about the right weight. Those who were also about the right weight who drank fruit juice about 2 times was less than those who only drank it 1 time. However, a surprising increase occurred when those who drank fruit juice about 7 times a week was greater than it should have been. It can be asserted that those people who drank fruit juice in excess throughout the week had higher metabolisms and therefore made it easier to stay their ideal weight. About 1000 responses replied that they did not drink fruit juice at all and reported they were about the right weight, and this can be seen compared to the other reports of weight (underweight, overweight, etc.) was the highest in this category. There is a common trend among all the weight reportings: people who said they drank fruit juice only 1-3 times in the past 7 days was higher than any other options.
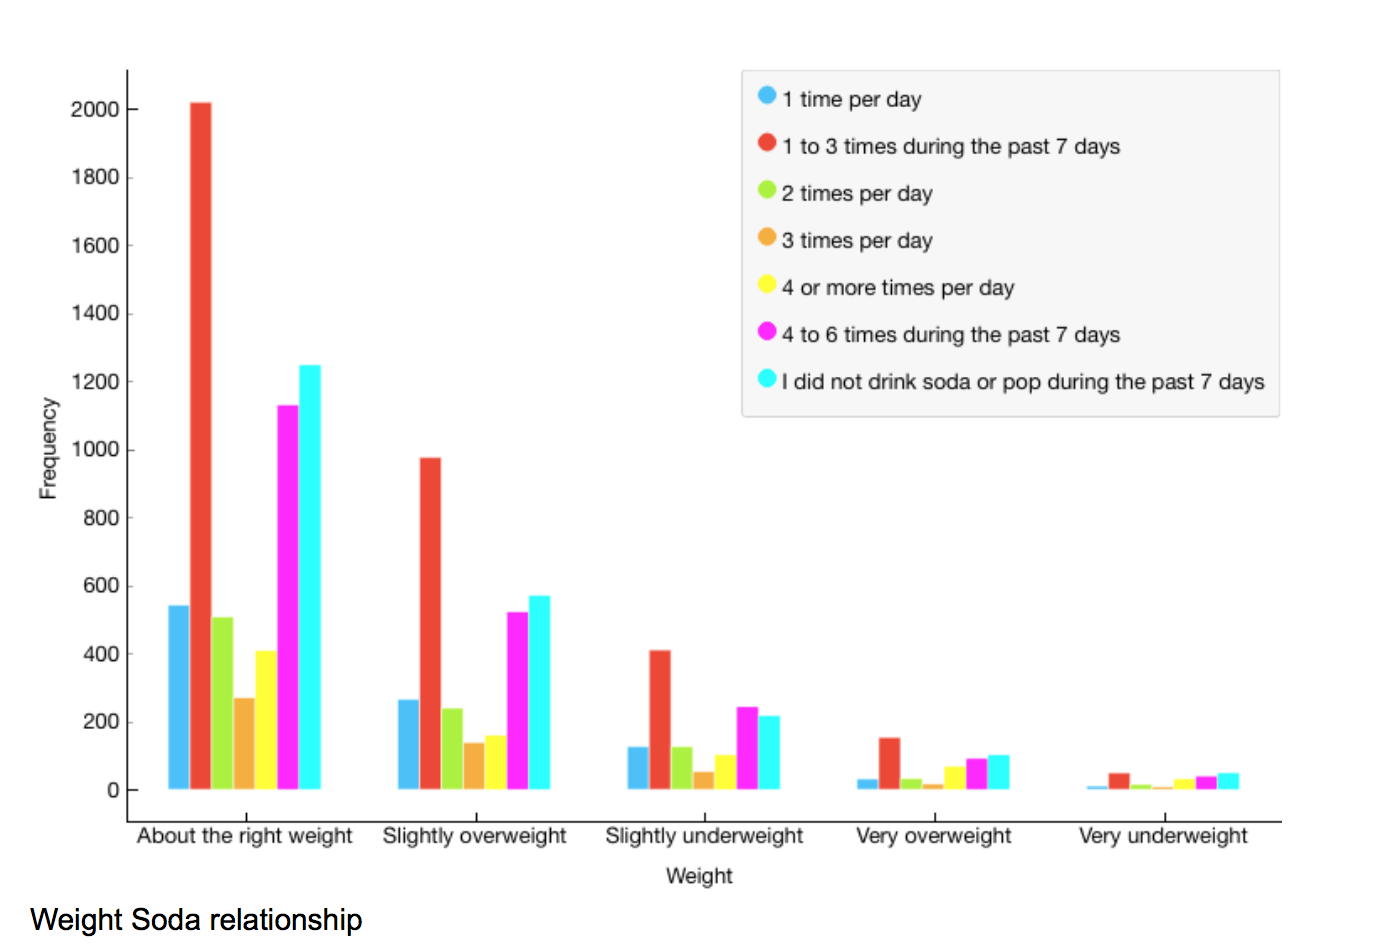
The data for weight and soda relationship is very similar to the reportings of drinking fruit juice. The data does not differ too much, besides the responses of people saying they did not drink soda in the past 7 days is slightly higher than the responses of people who said they did drink soda all 7 days of the week.
From the data we collected, students who said they did not drink any drinks high in sugar (juices, energy drinks, sports drinks) or drank drinks high in sugar only 1 to 3 times was the highest in the two categories < 124 lbs and 124 lbs - 176 lbs; the ideal and normal weight (what is not considered in this bar graph is the ages and heights of the responses in all the categories and may not accurately reflect the recommended ideal weight). The responses of drinking the high-sugar drinks are lower because there are less people categorized in that area.
In our activity bar chart data, there was a high response of people reporting that they took part in no activities compared to those who reported they did in the < 124 lbs and the 124 lbs - 176 lbs category. In the 176 lbs- 228 lbs category, there are less people in that category, but there was a slightly higher reporting of people who said they were inactive than those who did have activities. Whereas in the last category, the responses of activities were practically equal.
The scatter plot of our data, which shows the relationship between weight, time spent doing no activities, and how many times they drank a drink high in sugar, is similar to the bar plot that showed both of the separate relationships. Color coded by how many times they drank a high-sugar drink, students who did not drink had an ideal weight and had less hours of inactivity. This plot is a visual representation of how the weight of a student can reveal their habits and directly reflect their diet choices.
Extraneous Factors
After conducting our survey and research, we realized that we must take into account any extraneous factors before reaching a conclusion. Extraneous factors could easily include, hours of sleep per night, genetics, as well as the environment that an individual lives in. We didn't take these specific factors into account because we understood that this would create far too much data for us to analyze in a short amount of time.
Hours of sleep per night by most standards has a large effect on how health an individual is. At face value, most people assume "Oh 8 hours or more is good, 8 or less isn't". However there is so much more to this theory. Aside from simply an individual's weight, sleep can effect acne, hair growth, bodily growth, as well as mental stability. Our research told us that Albert Einstein slept only a handfull of hours each week, however his mental stability was terrible, and his mind was only able to use simply his IQ rather than mental fortitude. This is what lead to his death by Abdominal aortic aneurysm.
Genetics play a crucial role in everyone's health. It is very easy to notice that everyone is different in their shape, height, and body structure and have been for years. Stereotypically, someone can compare the average size of a Samoan man to the average size of a Japanese man. While of course these are jsut stereotypes, it is obvious that Samoan men are ususally much larger with much thicker bones. It is difficult to compare the health of these individuals simply by their weight, because they shouldn't be compared on the same scale. Genetics can definitely make a difference in the health of an individual.
The last factor that could effect one's health is the environment they live in. In some areas of the world, people have to make do with very little amounts of food, and in other areas, such as America, food is abundant. For example, in Somalia, most people are extremely skinny due to lack of both money and food avaiability in the country. This doesn't necessarily mean that Somalians are less healthy due to their lifestyle, because their bodies have adapted to their surroundings and environment. Similarly, Americans who are considered "overweight" are really just submissing to their surroundings. In a country where cheap food is so easily accessible, it should be considered normal in society for people to be able to gian large amounts of weight.
In conclusion, there are many factor's to people's health that we didn't consider in our survey. While considering these factors could have made a large impact into our data analysis, we wouldn't have known exactly how to implement the data to come to a solid conclusion. Weighing in hours of sleep would've forced us to take into account how many calories people burn while sleeping within each weight group. Genetic factors would've forced us to find the average weight for poeple in America by their ethnicity. And lastly, we would've had to find out the average weight of people living in the tri-city area to implement our environment's effect on health. These implementations are all ridiculous, and far too difficult to add to our brief analysis.
Conclusion
We can most definitely conclude that diet and activities in teenagers affect their weight and health. Within our data, it is clearly shown that those who feel as if they are about right weight (which is between 124-176 lbs.) are those who most active. They mostly participate in activities 7 days a week and are pretty healthy. The only contradicting data is the amount of sugar drinks that are being drank by those who fall in the 124-176 lb. range are a lot higher than those in the overweight or underweight ranger. The best explanation is that there were not as many people who answered in the overweight and underweight category. Also those who are active could easily work off those sugar drinks because of their activeness. But all in all, diet and daily activities are vital in determining whether you are healthy or not.
This data can be used as an implementation into school's health classes. Teachers can place an emphasis on the importance of one's diet when planning to lose weight, gain muscle, or even just live healthier lives. While our data isn't as in depth as what would be necessary, it is a solid foundation creating an outline for the differences that one's havits can bear on their lifestyle, and quality of life, both currently, and in the long run.